A new ecosystem for maritime surveillance?
A rethink of ground-level sensing payloads on existing buoys in the Arctic and European Sulphur Emission Control Areas (SECA).

Ninety percent of the worlds trade is carried by sea, it is the lifeline of global commerce. Due to global warming, the Arctic regions are seeing a significant increase in shipping activity. The high sulphur content in the fuel oil puts the delicate ecosystem of the Arctic at risk. An innovative sensing system is proposed that offers rendering of dynamic pollution maps using Automatic Identification System (AIS) data and environmental measurements. The system enables the unique correlation of ground-level atmospheric sensing and AIS tracking, augmented by wider coverage Sentinel tropospheric column data. Furthermore, measures can be taken against specific vessels as the registration number of the vessels is relayed via satellite upon exceeding certain emission thresholds based on ship (engine) size. A preliminary hardware demonstrator has been developed that indicates a very high level of feasibility and encourages further development and testing. The readings of the proposed sensing system offer enhancement of the Ship Traffic Emission Assessment Model (STEAM) with real-life data as well as insights in Arctic fishing activities from a quota and emission point of view. Finally, the system allows monitoring of regions such as the North European Sulphur Emission Control Area (SECA) both from a traffic and environmental point of view paving the way for sustainable shipping for Europe and the rest of the World.
1 Introduction
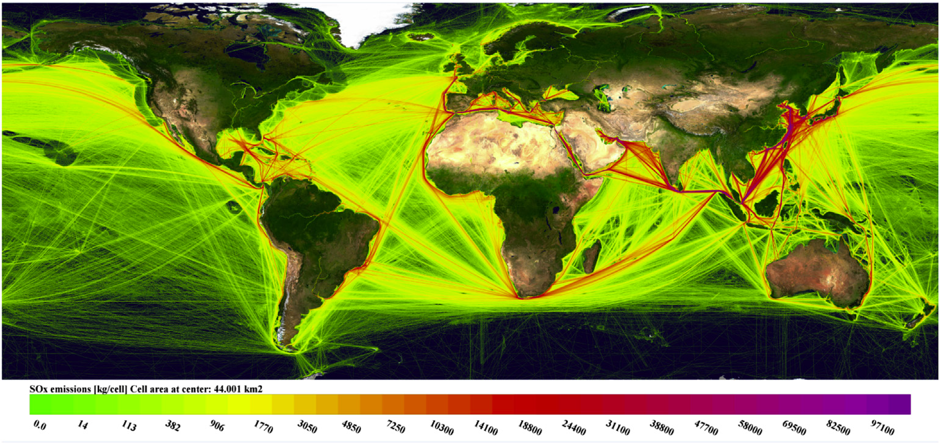
The Arctic are the few remaining regions of the Earth where the ecosystem is still relatively preserved. However, over the years, declining Arctic ice coverage has resulted in a significant increase in shipping traffic as the Northeast and Northwest passages offer much shorter distances between Europe and Asia as opposed to routes via the Panama and Suez canals [2]. The burning of heavy fuel oil with a high Fuel Sulphur Content (FSC) is a large contributor to the SO2 emissions of the shipping industry and puts the Arctic regions at risk. A systematic lowering of the Sulphur content in the fuel oil has been put in place by the International Maritime Organization (IMO). Zones have been defined, so called Emission Control Areas (ECA), where the allowed Fuel Sulphur Content is limited to a certain amount [3]. The Finnish Meteorological Institute (FMI) presented results of global shipping emissions in 2015 based on the Ship Traffic Emission Assessment Model (STEAM3), which uses Automatic Identification System (AIS) messages to describe the traffic activities of ships. The STEAM3 model has been significantly improved by means of scaling the emissions to vessel size and type by using data assimilation techniques and cross correlating with vessel registrations at the International Maritime Organization to get more accurate ship details and therefore more accurate emission models. Figure 1 illustrates the modelled SOx emissions by the shipping industry in 2015 as a result of the FMI study [1]. Shipping activity in the Arctic is expected to increase in the coming years as continued global warming is opening up new shipping routes in the North. Combined with increased Russian oil exploration activities in the area, this will again result in more heavy ship (tanker) traffic between major European ports and the Arctic. It is therefore vital that efforts to monitor this region are increased to preserve it in the coming decades.
In order to prepare for the increase in shipping activity in the Arctic, extra methods should be devised and put in place to pro actively monitor and to keep shipping sustainable. The proposed solution is elaborated in the next chapter.
2 Solution
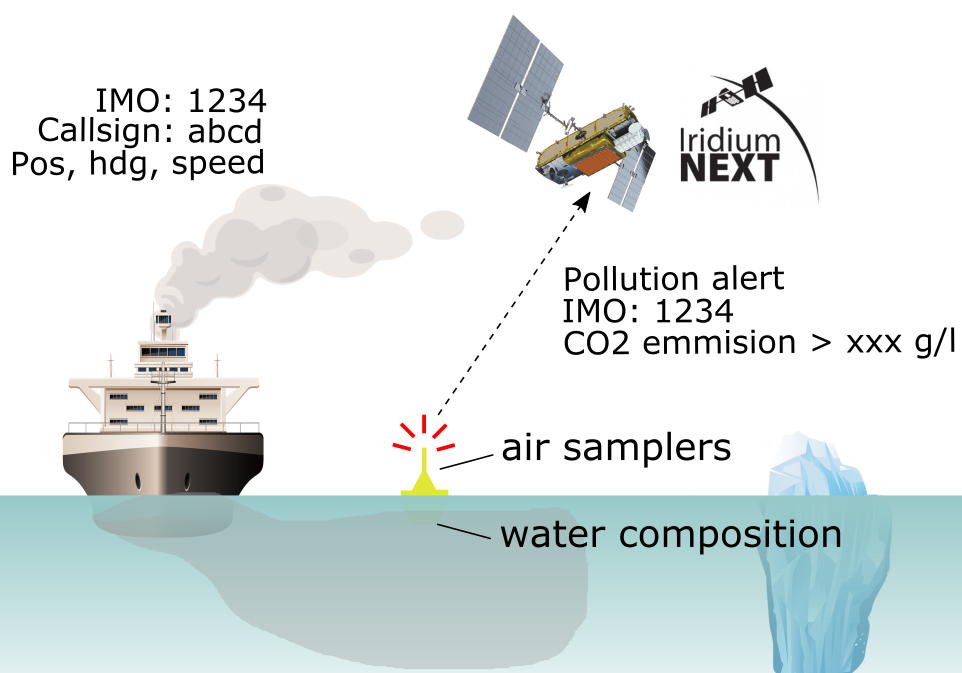
A wide range of tropospheric data products are already available on the Sentinel satellites of the Copernicus programme and have proven to be significantly contributing to the accuracy of sea and land-based studies. These are primarily provided by the Tropospheric Monitoring Instrument (TROPOMI) on Sentinel 5P [4]. However, extending the use of these datasets to shipping emission monitoring calls for methods that provide data at much higher intervals and spatial resolutions. Therefore a marine-terrestrial based sensing system is proposed that offers higher sampling rates, augmenting Sentinel data. Automatic Identification System (AIS) is a system which continuously broadcasts information about a vessel such as the position, speed, heading, callsign and registration number. By monitoring this data it is possible to generate a digital map of all ship movements in the nearby area. As AIS data is highly dynamic, the environmental data should also be of adequate availability, hence the argument for higher sampling rates. At the same time, atmospheric data is gathered and logged. The atmospheric data consists of environmental data (wind direction, wind speed, air pressure, temperature and humidity), and chemical data (aerosol concentrations of several greenhouse gases). This concept is illustrated in figure 2.
By correlating the data in a smart way, it is possible to enhance the understanding of the contribution of shipping emissions in the Arctic. Furthermore, since ship traffic is logged, it is possible pinpoint polluting vessels. The exact method of data correlation and prediction is illustrated in the next chapter.
2.1 Theory of operation
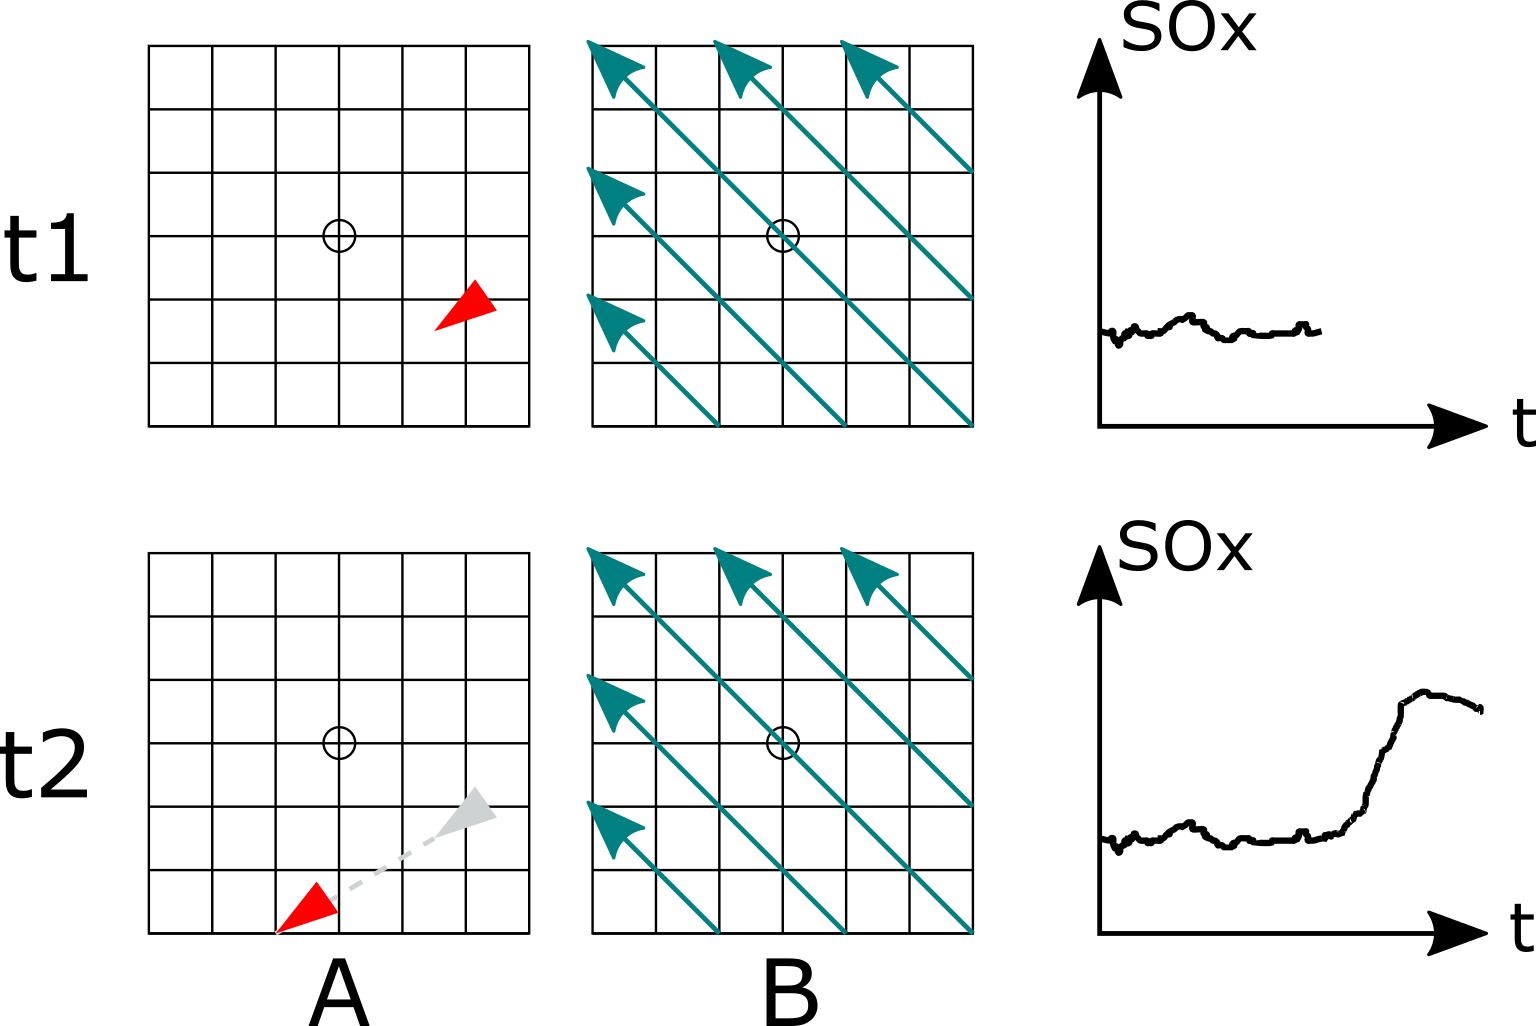
Logging AIS targets effectively translates into sampling a grid of vectors (ships) with each their own direction and speed. At the same time a wind vector measurement is taken by an anemometer. A model can be constructed by overlaying these two dynamic data-grids. By propagating this model in the time domain, it is possible to determine the origin of an increase in for example a SO2 reading and pinpoint it to a specific vessel with a certain confidence level. Several BMUs using the same algorithm can increase this confidence level. This is illustrated in figure 3. Column A represents the AIS targets that are received by the Buoy Mounted Unit (BMU), column B represents the wind vector measurement. Two grid samples at different times (t1 and t2) are plotted. A rise in the SOx reading can now be traced back to the old position of the vessel at t1 using previous AIS tracks and wind vector data.
Upon exceeding a certain emission threshold of a certain greenhouse gas, the system reports the registration number of the vessel that most likely produced the emission according to the propagated model. This operating scheme allows the International Maritime Organization to take measures against specific vessels and/or shipping companies not adhering to emission regulations.
3 Hardware demonstrator
Certain hardware is needed in order to fulfill the tasks outlined in the solution section. A preliminary hardware demonstrator has been developed to provide an indication of needed hardware to comply with the mission requirements and to asses the feasibility from a hardware point of view. The following paragraphs illustrate how these systems will work and how they are implemented.
3.1 Connectivity
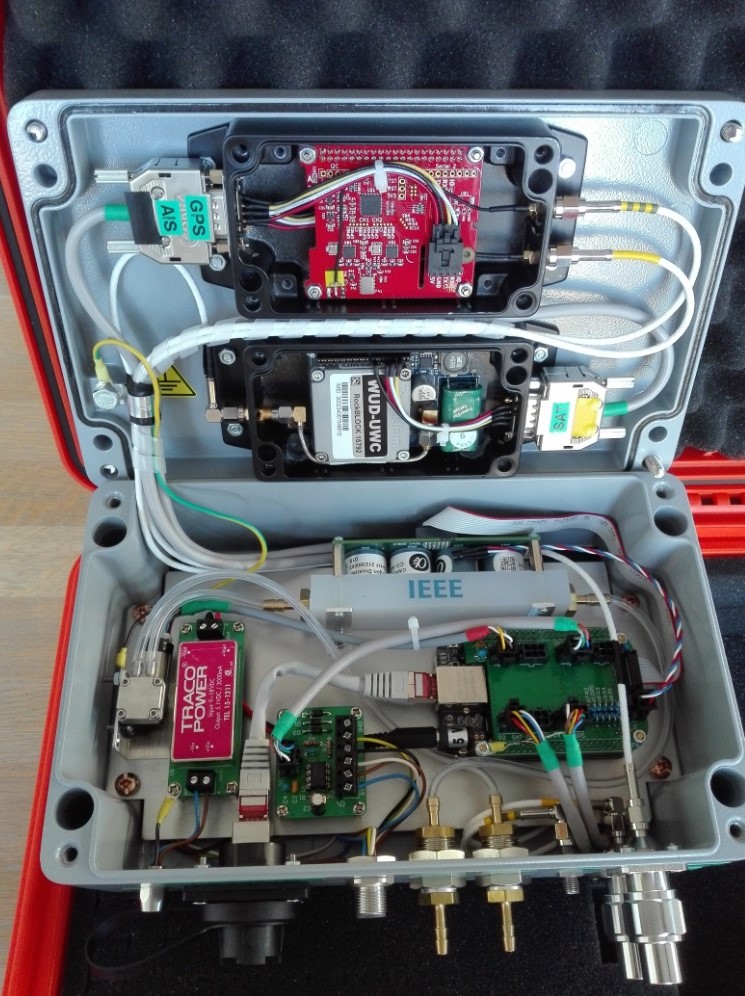
An internal AIS receiver is used to register the positions of all the ships in the area. A Galileo enabled receiver allows the buoy to precisely determine its position. This position data is also used in the daily status reports it sends over satellite. The satellite messages are carried over the Iridium NEXT network which offers excellent polar coverage. Since the buoy will be located in very remote places, a satellite modem is vital for the system to be able to report its status and receive operational commands. Remote commanding of the buoy is also possible via satellite. A close-up view of the insides of the prototyped BMU are illustrated in figure 4. The AIS and Galileo receiver as well as the satellite modem are located in the top of the unit. The bottom of the unit houses the embedded processor (Beagle Bone Black) and the gas sensor array.
The unit can work standalone or be interfaced and synchronized to other instrumentation systems using an Ethernet TCP/IP protocol. Operational commands can be executed via the TCPIP or remotely via satellite.
3.2 Sensors
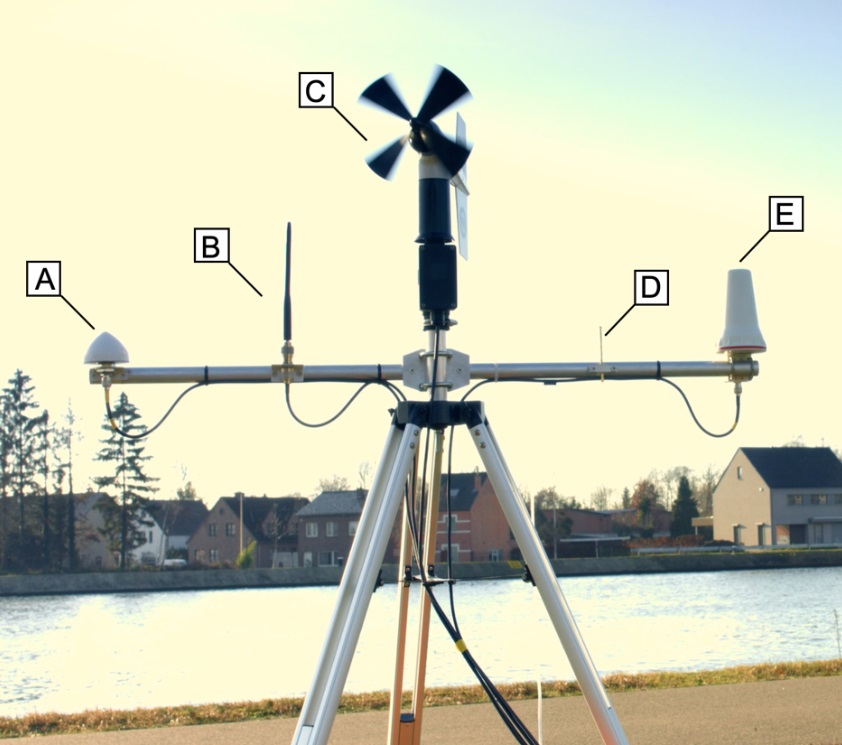
The gas sensor array is internally mounted and air is drawn through it using a long-life micropump. The sensor signals are acquired by the embedded processor and further processed. The wind measurements are carried out with a marine anemometer. A prototype external sensor array configuration is illustrated in figure 5.
4 Expected results
4.1 Arctic trials
Since the platform is intended to do monitoring in Arctic environments, initial testing campaigns would give a good indication whether or not the system is compatible with the harsh Arctic environment and provides the desired results.
4.2 Data
Since the proposed BMU will provide data at higher sampling rate and spatial resolutions, it will be easier to correlate it with dynamic AIS data. Emissions from large vessels along shipping routes should clearly be visible in the readings, and through the vector grid propagation, be reported over satellite. From the study of the Finnish Meteorological Institute, in excess of 300.000 vessels were found to be non IMO-registered which complicates technical data to be included in the emission study. It is therefore impossible to determine how polluting these ships really are from AIS data and technical database information alone, and therefore real-life measurements must be taken by remote platforms. In the study, the distinction was also made between the type of vessels. It was found that the largest contributor of Arctic shipping activity were fishing vessels. Not all fishing vessels carry AIS equipment, and there fore could lead to underestimates of shipping activity. As both AIS and environmental data are monitored, the BMU should give a good idea of real-time fishing activities and this data can also be used to compare with fishing quota to prevent over-fishing of the Northern regions.
5 Conclusion
The proposed sensing buoy configuration offers precise ground level measurements. With the ground-level augmented Copernicus data, the STEAM3 model can be greatly enhanced offering a better insight in global fleet emissions and pave the way for a more sustainable shipping industry for Europe and the rest of the World. Not only does the BMU offer enhancements of the STEAM3 model, it also gives insight in Arctic fishing activities both from a fishing quota and emission point of view contributing to a long term sustainable fishing strategy. Finally, the system allows legal measures to be taken against specific vessels as registration numbers are logged and through vector grid propagation with the gas sensor readings, the approximate emissions can be determined. The certainty can be improved by having multiple BMUs along the shipping routes performing the same grid propagation technique. By placing additional units in the North European Sulphur Emission Control Area (SECA), this region can additionally be monitored both from an AIS traffic and emission point of view.
6 References
[1] Lasse Johansson, Jukka-Pekka Jalkanen, and Jaakko Kukkonen. Global assessment of
shipping emissions in 2015 on a high spatial and temporal resolution. Atmospheric
Environment, 167:403–415, October 2017. ISSN 13522310. doi: 10.1016/j.atmosenv.
2017.08.042. URL https://www.sciencedirect.com/science/article/pii/S1352231017305563?via%3Dihub
[2] Frederic Lasserre. Arctic Shipping: A Contrasted Expansion of a Largely Destinational
Market. In Matthias Finger and Lassi Heininen, editors, The GlobalArctic Handbook,
pages 83–100. Springer International Publishing, Cham, 2019. ISBN 978-3-319-91994-2 978-3-319-91995-9. doi: 10.1007/978-3-319-91995-9_6. URL http://link.springer.com/10.1007/978-3-319-91995-9_6
[3] International Maritime Organization. Sulphur oxides (SOx) and Particulate Matter (PM) âA ¸S Regulation 14. URL https://www.imo.org/en/OurWork/Environment/Pages/Sulphur-oxides-(SOx)-%E2%80%93-Regulation-14.aspx
[4] Mattia Pedergnana. Sentinel-5 precursor/TROPOMI Level 2 Product User Manual Sulphur Dioxide SO2. (01):158. URL https://sentinel.esa.int/documents/247904/2474726/Sentinel-5P-Level-2-Product-User-Manual-Sulphur-Dioxide
Notice:
This paper was written and submitted in the framework of the ESA-EISC Space for Sustainability Award 2019 and may be distributed freely in print or electronic forms. See Terms and conditions
This work additionally received funding from IEEE New Initiatives Committee (NIC) and the Geoscience Remote Sensing Society (GRSS), project designator R4041.
PDF version of this work available here